
Rod MacKenzie and I are looking for a postdoctoral researcher,  mainly for doing device simulations with Rod’s OghmaNano combined with machine learning. The position is for more than 2 years, at TU Chemnitz in Germany. We have a strong collaborative team beyond our groups, within the DFG Research Unit P☀PULAR on printed organic solar cells and the ChemDeTOX project on chemical defects in conjugated polymers. If you are interested, please find the details on the TU Chemnitz job portal (German and English).
Author: deibel
How to see the temperature dependence of the open-circuit voltage from the ideal diode equation?
The open-circuit voltage is the voltage in the current–voltage characteristics of a solar cell that is defined where the current is zero. That means that the (internal) charge carrier generation and recombination rates are equal, so that no net current can flow out of the device.
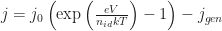
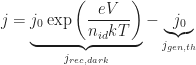
We can simply rearrange the ideal diode equation and solve for the open-circuit voltage.  The ideal diode equation was discussed with respect to the ideality factor in this post. The current density is given as

with 


As the open-circuit voltage is determined at zero net current, 

which we can rearrange to yield the open-circuit voltage

Here, 


is usually a very good approximation.
This simple equation to describe the open-circuit voltage is very general and can describe (outside of the shunt region, which is not considered here) very different solar cell technologies correctly. The reason is that many parameters that differ for different semiconductors are accounted for. So what determines the open-circuit voltage?
At a given temperature, the open circuit voltage is determined by
–
–
– 
The generation current density

which means it is given by how much of the solar photon flux of the sun, 


The dark saturation current density in an ideal solar cell without non-radiative losses is essentially given by

The only difference to the equation for 


With this in mind, we can maybe see already what determines the temperature dependence of the open-circuit voltage! In

there is an explicit temperature dependence in the prefactor,
Except for temperature-dependent changes in the charge collection (or bandgap), 
When we approximate the equation for the ideal dark saturation current density (ideal, because we again neglect non-radiative losses) from above – using the Boltzmann approximation instead of the Bose-Einstein statistics that are featured in Planck’s law – we can describe the temperature dependence of

The temperature here is, again, the solar cell’s and the ambient temperature is equal to it. We assume for simplicity (again a pretty good approximation) that the bandgap 


We see now that the maximum open circuit voltage at zero temperature (in a system described by classical Boltzmann approximation,  for a-Si H solar cell.jpg") i.e. without the energetic disorder that is an important topic in organic solar cells) is given by the (effective) bandgap of the device – usually the bandgap of the active layer material. The open-circuit voltage is reduced at higher temperatures(!) despite the plus sign after the term
i.e. without the energetic disorder that is an important topic in organic solar cells) is given by the (effective) bandgap of the device – usually the bandgap of the active layer material. The open-circuit voltage is reduced at higher temperatures(!) despite the plus sign after the term 
I’ll leave it here for now, with two comments: first, there is more to be said about why one always should use the ideality factor in the equation 
Transport resistance strikes back
Since the last time that I wrote on transport resistance as a voltage loss mechanism in organic solar cells, due to low active layer conductivities, we have continued working on it. 
While we learnt from our valued colleague Prof. Chang-Qi Ma that MoOx diffusion contributes strongly to fill factor losses by thermal degradation – they had published their convincing results in [Qin 2023], under our radar – we also understand better how to recognise and comprehend transport resistance losses.
The simplest way to characterise transport resistance is to determine the difference between a normal current density–voltage curve under 1 sun, and the suns-Voc curve. The latter is the pair-wise combination of generation current density and open-circuit voltage that is giving one current density-voltage point per light intensity: doing this for a wide range of light-intensities results in a pseudo-JV curve. To compare this suns-Voc curve to the current density–voltage curve under 1 sun, it has to downshifted so that the open-circuit voltage of both curves coincide on one point: 


 If a solar cell has a low active layer conductivity and is transport resistance limited, than the measurement of the suns-Voc curve to construct the
Also indicated in the figure are two further figures-of-merit to distinguish the measured JV curve and the series resistance-free pseudo-JV curve: the slopes around the open circuit voltage (indicated in the figure by 

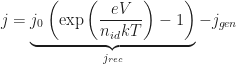
The suns-Voc curve is used in the literature to determine the recombination ideality factor of solar cells. Even on the linear scale, the (inverse) slope of the corresponding 
where the recombination current density equals 


 For a selection of devices that we characterised for [Saladina 2025], we show on the right-hand-side the impact of transport resistance on the fill factor. The upper limit of the FF (solid line) can be reached when the recombination ideality is unity and there are no transport resistance losses. The FF (open circles) is often much lower, but in modern devices such as PM6:Y6 it can exceed 75%. The pseudo-FF (filled circle), however, is much closer to the upper limit, and is due to the trap-assisted recombination found in organic solar cells, at ideality factors that are often larger than unity. All in all, the largest loss for the fill factor is the transport resistance loss, essentially the difference between the pseudo-FF and the FF, even for the (not shown here) record-efficiency organic solar cell devices! I believe it makes a lot of sense to quantify the transport resistance in all publications that present the performance organic solar cells, so to avoid drawing wrong conclusions – for instance, that a given low fill factor is due to recombination, when the FF loss is likely dominated by low active layer conductivities. This is even more important when looking at the losses of organic solar cells with thicker active layers.

If you want to understand more about the transport resistance loss, I recommend (and self-advertise:) Maria’s paper, [Saladina 2025]. It contains information on how to predict the pseudo-FF just from the recombination ideality factor, how the conductivity of the active layer can be determined from the transport resistance, that
Pitfalls when measuring recombination lifetimes in organic solar cells
Six years ago, I came across an interesting publication by David Kiermasch and Kristofer Tvingstedt, [Kiermasch et al 2018],  titled Revisiting lifetimes from transient electrical characterization of thin film solar cells; a capacitive concern evaluated for silicon, organic and perovskite devices. It shows that particular in thin film solar cells, the time constant determined by voltage based techniques – open circuit voltage decay (OCVD), transient photovoltage (TPV), intensity modulated photovoltage spectroscopy (IMVS) – is in many cases not the recombination lifetime, but corresponds to an RC-time from the device itself. While the authors did not find this effect, they showed impressively how most modern solar cells are limited in this respect, and it has to be verified carefully whether or not the experimentally determined time constants do correspond to recombination lifetimes!
I took this publication very seriously. Below I show you a summary slide I made for my group seminar in the year of publication, 2018.

The shown equation was actually animated, sorry for making your life harder (but mine easier;). Briefly, the idea of why an RC limitation shows up is the following. The charge in the device 

where the first term on the right hand side represents the recombination rate – of which we want to measure the recombination lifetime 
As you can see in this slide, based on our data, for P3HT:PCBM (bottom left of the slide) the capacitive (RC) times remain lower than the measured time constants. We can state with some confidence that the RC times do not limit the measured recombination lifetimes. Also, the slopes of 
In contrast, for the PCDTBT:PC70BM solar cell, for which I took the measured time constants at room temperature from literature, you see that the RC time limits the recombination lifetime, as the measured time constants just correspond to the RC times. This implies that the recombination lifetime is too short to be measured for the given RC limitation.
A nice aspect of the paper by Kiermasch et al. is that it gives a comparatively simple way to estimate the RC times:

Here, 


Please note, that in this particular RC time where both 

All of this came to my mind again when looking at IMVS data that we took on PM6:Y12 solar cell devices (made by Chen, measured by Nino with support from Christopher).

On the left, you see the estimation of the RC time 

While quite sad, I think this is important: if you want to determine recombination lifetimes in thin film solar cell devices, check for limitations by RC times and shunt.
The transport resistance in organic solar cells
In one of my last posts on the diode ideality factor (6 years ago…), I promised to talk about the transport resistance in organic solar cells.  I came across it already during my time at IMEC in Leuven, Belgium, around 2004: my colleagues and I worked on an analytic model of the open circuit voltage in organic bilayer solar cells. The corresponding paper was published a few years later, [Cheyns et al 2008], but I have to admit that I did not grasp its importance as a relevant loss mechanism for organic solar cells in general, focussing on geminate and nongeminate recombination – until this paper by [Würfel/Neher et al 2015] came out. I think now I have;)
The transport resistance is an internal resistance in the active layer (or transport layer(s)) of the solar cell, acting like an internal series resistance: It changes the slope of the current density–voltage characteristics – for instance around the open circuit voltage – and thus reduces the fill factor.
If you can live with an effective conductivity 
with the effective carrier concentration 


 - contributions to current-voltage characteristics - variation 2.png") is reduced by
is reduced by 

 The upper left inset features the band bending of the transport resistance free case at a current–voltage point in the fourth quadrant of an illuminated solar cell,

Still, the voltage drop due to the transport resistance – coming from the low conductivity and leading to the tilted transport levels – is real and does reduce the fill factor.
In my recent talk at the MRS Spring meeting (invited! in person! on Hawaii! slides here:), I showed the approximate difference of the internal and external voltage of a fresh, inverted PM6:Y6 bulk heterojunction solar cell ( The ideal diagonal case where
How did we determine the approximate internal voltage, or

is influenced by the series resistance 


so that the terms including the series resistance (but not the parallel resistance!) become zero as well. Reordering the equation,

we have an equation very similar to the diode equation (*). The pairs 


An example of how a Suns-Voc curve looks is shown in my earlier post on the diode ideality factor in the third figure (red = illuminated 
Of course there is a better way by measuring both the voltage dependent current and luminescence of a solar cell, as done by [Rau et al 2020] on Cu(In,Ga)Se2 solar cells: from the luminescence, which depends on the quasi-Fermi level splitting, the internal voltage can be determined. For organic solar cells, as singlet and charge transfer exciton photoluminescence need to be separated – the internal voltage will be proportional to the latter – this is harder and has not been done yet, as far as I know.
How can the impact of the transport resistance on the fill factor, and thus performance, of organic solar cells be minimised? To reduce the transport resistance, the active layer conductivity needs to be increased. This can be done by, either, increasing the charge carrier mobility – for a molecular hopping system this means reducing static (low 

Some hat tips here beyond the very nice cooperation of our study: Maria and Rod for feedback to an earlier version of the post, and Julien for being the first commenter on it:)
Links
Some links collected over the last months.
- I am sure you have heard of the hybrid perovskite solar cells. Here the current Best Research-Cell Efficiency Chart from NREL: the perovskite efficiencies improved quite rapidly to more than 22% power conversion efficiency (let’s hope the stability improves as well), but other thin film PV technologies such as CIGS also gain momentum again, as evidenced by the increasing slope in the chart;-)
- related to efficiency reporting: NREL article Claims for Solar Cell Efficiency Put to Test at NREL featuring Keith Emery who is well known for coauthoring the Solar Cell Efficiency Tables
- For a reading list on hybrid perovskite solar cells (and if you do not mind Mendeley so much), see a large collection at the corresponding Mendeley group initiated by Aron Walsh
- Matt Might’s Productivity tips, tricks and hacks for academics. I linked to this in 2012, but it is regularly updated and also worth to be read again. See also the other articles and howtos. Let me highlight the posts cripple your technology as productivity boost for focussed work, and How to get tenure in view of an academic career
-
Terence Tao’s Career advice. While focussed on an academic career in mathematics, it is relevant also for natural sciences.
- By the way, a nice portrait on Terence Tao can be found in the Ney York Times Magazine: The Singular Mind of Terry Tao
- I was reminded again by a post of Ross McKenzie of the Last Week Tonight Show by the comedian John Oliver on Scientific Studies
-
tweet by F X Coudert on a paper retraction: resigning as (co)author afterwards should not be possible!
- Related from the Retraction Watch Blog: Weekend Reads and a summary of recent posts
- The Feynman lectures on physics for free online reading (probably linked to them before)
-
Kingsreview: How Academia and Publishing are Destroying Scientific Innovation: A Conversation with Sydney Brenner
-
Patt Thomson on the pdf alibi syndrome. Know thyself…
-
A Nature Editorial: Take more risks – Scientific innovation is being smothered by a culture of conformity
-
Nature’s Monya Baker asks if there is a reproducibility crisis in science: 1,500 scientists lift the lid on reproducibility. Shows clearly that impact and reporducibility should have a better balance
-
Anonymous academic writes in The Guardian, Academics are being hoodwinked into writing books nobody can buy – Interesting and somewhat depressing experience regarding the scientific publishing business
-
For beginners and advanced referees: Niklas Elmquist on Mistakes Reviewers Make
I will be at the ISCPAC 2016 meeting next week. In case you are also there, meet up:-)
[2016-06-07 Some Updates in the afternoon;-)]
The diode ideality factor in organic solar cells: basics
Where does one start after so long an absence — meaning only the blog abstinence; I have been working and publishing since last time;-)  One of the things which have been on my mind is the ideality factor, a figure of merit for the charge carrier recombination mechanism in a semiconductor diode. In short, a diode ideality factor of 1 is interpreted as direct recombination of electrons and holes across the bandgap. An ideality factor of 2 is interpreted as recombination through defects states, i.e. recombination centres. More on that in a later post, let’s start with the basics.
A couple of years ago, I wrote about some general properties of current-voltage characteristics of organic solar cells, but did not describe the ideality factor.1 I think the ideality factor was mentioned only once, and then without details.
The Shockley diode equation describes the current–voltage characteristics of a diode,
Here, 
The current
However, the term 


so that at negative voltages, 
 (Please note that under realistic conditions,
How can one determine the ideality factor and the dark saturation current (at least in principle, see below for a better way on real devices)? It is common to neglect the thermal generation current (the term -1, multiplied by

so that the ideality factor can be determined from the inverse slope of the ln(current) at forward bias, and the dark saturation current from the current-axis offset. Let me already tell you that I do not recommend this approach, for reasons written below, and as explained in more detail in a recent paper of Kris Tvingstedt and myself [Tvingstedt/Deibel 2016].
Under illumination and at open circuit conditions, 

which has the same shape as the Shockley equation in the dark. This means that if you measure (
Interaction of light with solids in experiment and simulation
Hi there, sorry for not getting back to you but starting a new group and having new responsibilities (e.g. involvement in new degree programmes for Material Science) can take (part of) the blame. ") Just as brief progress indicator, here a link to an interview of the Chemnitz University of Technology press office with me. (Photo: Uwe Meinhold)
Just as brief progress indicator, here a link to an interview of the Chemnitz University of Technology press office with me. (Photo: Uwe Meinhold)
The official short name of my group is OPKM, for Optics and Photonics of Condensed Matter. For the (very) long official name I refer you to the web page of the Institute of Physics at the TUC;-) The size of my group is growing slowly but steadily, and the lab building shows progress as well: setups for time correlated single photon counting to measure photoluminescence transients – e.g. to determine charge carrier recombination in perovskite solar cells – and for confocal measurements of luminescence are already available from my predecessor’s group: we just adapt them to our needs. Other setups, time resolved and steady state, are being built and come along nicely. Solar cell preparation is still improvised, using the glovebox system of a colleague and the evaporation chamber of another, until we get our own integrated glovebox/evaporator system. One of my main interests is still Organic Photovoltaics, and with my (PhD) background in inorganic photovoltaics I also look at the hybrid perovskite solar cell hype (as a hype is not necessarily a bad thing;-). What also remains is my joy to combine experiments and simulations (macroscopic device simulations, kinetic Monte Carlo simulations) to understand these systems.
If you are interested in joining us: I have two PhD positions available at present. Please check out the job offer (german; computer-translated here) and contact me.
Cheers!
Restarting in Chemnitz
Just a brief note, ![]() I moved from Würzburg to the Institute of Physics at Chemnitz University of Technology this March, starting a new group. At present I have one PhD position open on Organic Photovoltaics – funded by the University, therefore including some teaching duty in German. Have a look here (in German) or drop me a line if you are interested. Cheers,
I moved from Würzburg to the Institute of Physics at Chemnitz University of Technology this March, starting a new group. At present I have one PhD position open on Organic Photovoltaics – funded by the University, therefore including some teaching duty in German. Have a look here (in German) or drop me a line if you are interested. Cheers,
Carsten
Links
Some links I found interesting since the last time… partly older stuff, though.
- already in 2010, Mitch from the Chemistry-Blog posted the Carreira letter
- On the way to tenure… or not:
- Sean Carrol for Cosmic Variance on How To Get Tenure at a Major Research University
- Terran Lane On Leaving Academia
- Radhika Nagpal on The Awesomest 7-Year Postdoc or: How I Learned to Stop Worrying and Love the Tenure-Track Faculty Life
- I also liked the book A PhD is not enough: A guide to survival in Science by Peter Feibelman on how to succeed staying permanently in science
- Publishing:
- Brian Doyle for Kenyon Review on Rejection letters
- Roy F. Baumeister’s very useful Sample Cover Letter for Journal Manuscript Resubmissions ;-)
- Nature on Authorship: Who’s on first?
- Michael Nielsen on Three myths about scientific peer review. I like the Einstein quotation a lot!
- Joesph Esposito from the scholarly kitchen on Help! I’ve Been Plagiarized. I know how it is.
- Scientific paper on Big Science vs. Little Science: How Scientific Impact Scales with Funding by Fortin and Curry in PLOS one. Answer: little.
- Jeff Bezos on 37signals says that people who were right a lot of the time were people who often changed their minds.
- jasonya on Scientific paper easter eggs;-)
- This Is How Your Brain Becomes Addicted to Caffeine by Joseph Stromberg. In any case, if you are at it also read Michael Haft and Harrison Suarez on How to Make Perfect Coffee (in the “Health” section of The Atlantic:)
- If you are into Lifehacks etc, Cal Newport on how to Drastically Reduce Stress with a Work Shutdown Ritual
